
 As the 2024 U.S. presidential election approaches, many investors are anxious about the impact politics might have on their portfolios. While this concern is primarily driven by the uncertainty a typical election year brings, a review of past cycles suggests that the upcoming presidential election shouldn’t be a cause for concern.
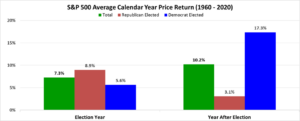
To better understand the typical market dynamics during election years, we analyzed the returns of U.S. stocks over the last 60 years and compared those results to the returns generated during presidential election years and the year immediately following election years.
Since 1960, the S&P 500 has averaged an annualized price return of roughly 8.2%. As you can see from the chart below, returns during a U.S. presidential election year were slightly below average, coming in at 7.3% per year. However, returns generated the year after a U.S. presidential election were significantly above average, at 10.2% annually. We also reviewed the returns during calendar years when a Republican or Democrat was voted into the White House, though it’s worth noting that there’s a limited sample size (i.e., 16 U.S. presidential elections since 1960, with an even split between appointed Republicans and Democrats).
If a Republican was elected, returns were roughly 9% per year during the election year (higher than the average annual return since 1960). In contrast, if a Democrat was elected, returns were below average at 5.6% per year during the election year. Meanwhile, the opposite was true during the calendar year following an election. If a Republican was elected, returns only averaged 3.1% per year, while if a Democrat was elected, returns averaged a whopping 17.3% per year in the year following a U.S. presidential election.
There are of course many factors that impact performance in a given year, and macroeconomic trends such as growth, inflation, and the level of interest rates tend to demonstrate a stronger relationship with asset returns than the discrete results of a specific election. For example, during the 1980 election year, the S&P 500 rallied approximately 26% as newly elected Chairman of the Federal Reserve (“the Fed”), Paul Volcker, was able to begin reigning in stubbornly high inflation that began manifesting in the late 1970s. Conversely, the S&P 500 was down 38.5% during the 2008 election cycle, driven by the burgeoning global financial crisis and the damage it inflicted on the economy and markets. In both cases, markets reverted the following year as the S&P 500 declined roughly 10% in 1981 as inflation resurfaced, and rallied 23.5% in 2009 as the Fed embarked on quantitative easing. Therefore, it’s important to understand the economic and market backdrop leading into an election year, and how that backdrop evolves: Is the economy on solid footing? Are interest rates accommodative or restrictive? Are asset prices over or under-valued? Are corporate profits sustainable? And so forth.
As you will see from our 2024 market outlook, we’re cautiously optimistic regarding the U.S. economic backdrop heading into the new year. However, the market is starting to become expensive at the index level, as the S&P 500 will likely end 2023 up over 20%. Still, many pockets of the market failed to participate in last year’s rally, and several attractively priced companies with long-term return potential remain. High quality U.S. government and corporate bonds are another important portfolio diversifier, especially as the Fed pivots towards easing policy. Despite the near-term uncertainty an election year typically brings, we believe a diversified portfolio of high-quality growth and dividend-paying stocks, combined with appropriate amounts of short-to-intermediate term bonds and cash, will help our clients meet their financial goals. Contact Us for assistance with your investment strategy.
LEGAL, INVESTMENT AND TAX NOTICE: This information is not intended to be and should not be treated as legal advice, investment advice or tax advice. Readers, including professionals, should under no circumstances rely upon this information as a substitute for their own research or for obtaining specific legal or tax advice from their own counsel. Not FDIC Insured | No Guarantee | May Lose Value
About The Sanibel Captiva Trust Company
The Sanibel Captiva Trust Company of Sanibel, Florida and its divisions The Naples Trust Company and The Tampa Bay Trust Company; an independent firm with $4 billion in assets under management that provides Family Office and Wealth Management Services, including investment management, trust administration and financial counsel to high-net-worth individuals, families, businesses, foundations, and endowments. Founded in 2001 as a state-chartered independent trust company, the firm is focused on wealth management services that are absolute-return oriented and performance driven. Each portfolio is separately managed and customized specifically to the client’s yield and cash-flow requirements. Offices in Sanibel-Captiva, Fort Myers, Naples, Marco Island, Tampa, Belleair Bluffs, and Tarpon Springs. www.SanCapTrustCo.com